When managing a VPS, two essential questions quickly arise: is my server secure? and how can I monitor its state in real-time? After experiencing my first intrusion attempts and realizing the importance of complete infrastructure visibility, I decided to set up an online-accessible monitoring dashboard.
In this article, I’ll present the solution I deployed, based on the PLG stack (Prometheus, Loki, Grafana), along with the essential minimum security measures to protect a VPS.
The PLG stack
The PLG stack is similar to the ELK stack (Elasticsearch, Logstash, Kibana) but offers a more lightweight and resource-efficient alternative. It combines three complementary tools that together provide a full view of your infrastructure.
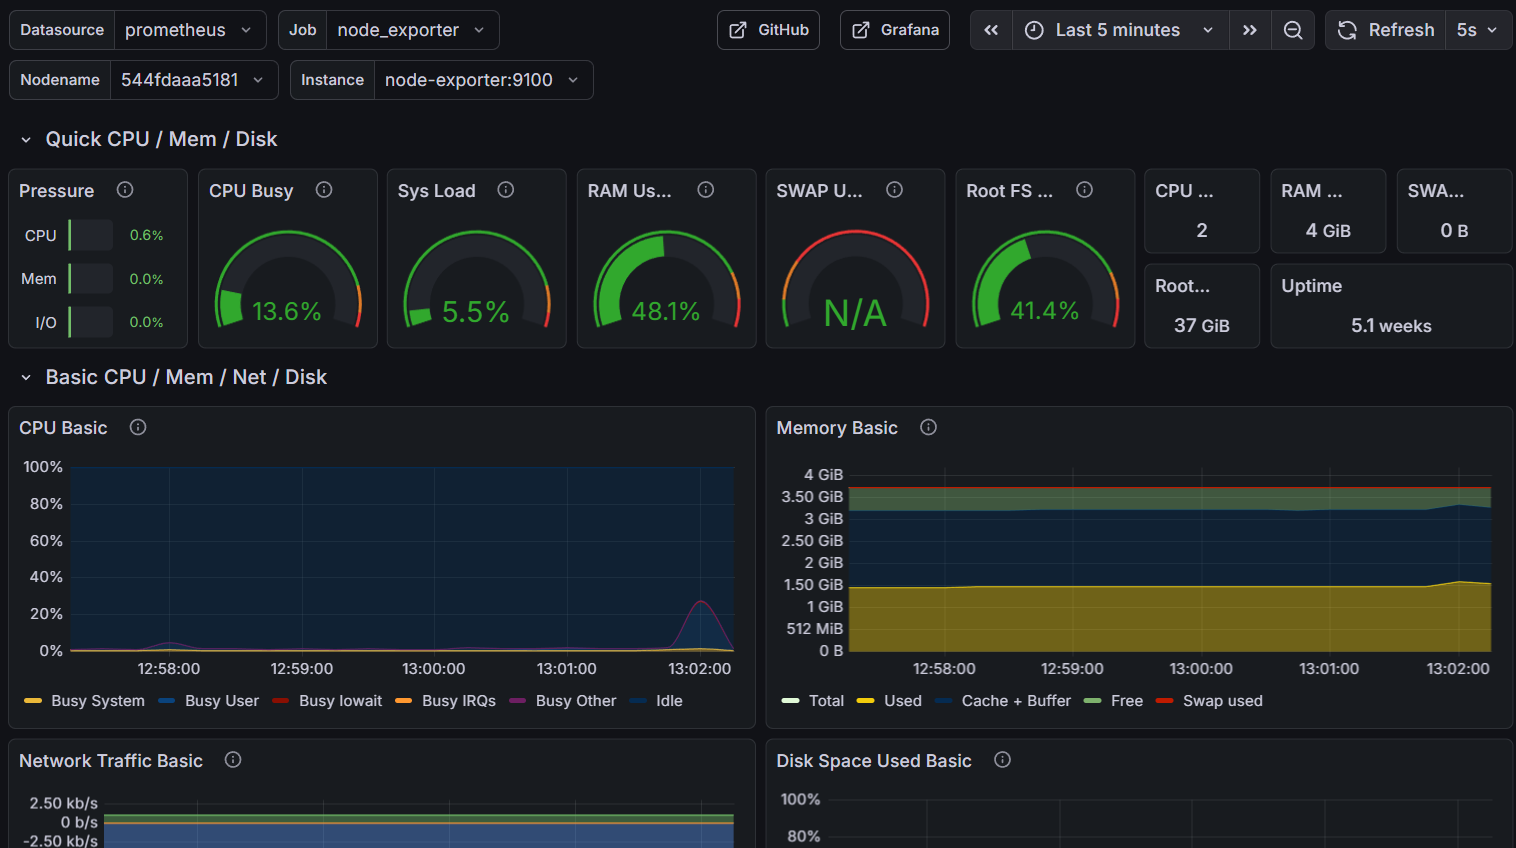
Prometheus: real-time metrics
Prometheus is the heart of the metrics system. This open-source monitoring system collects and stores time-series metrics. In my case, I use several exporters:
- Node Exporter: collects system metrics (CPU, RAM, disk, network)
- Custom exporters: for specific application metrics
The collected data allows me to visualize resource usage in real-time.
Loki: log centralization
Loki is often described as “Prometheus for logs.” Rather than indexing log content like Elasticsearch would, Loki only indexes metadata, making it extremely efficient in terms of storage and performance.
I use Loki to centralize:
- System logs (syslog)
- Application logs
- Security logs (especially fail2ban)
- Docker service logs
This centralization is crucial for correlating events and quickly understanding what’s happening on the server.
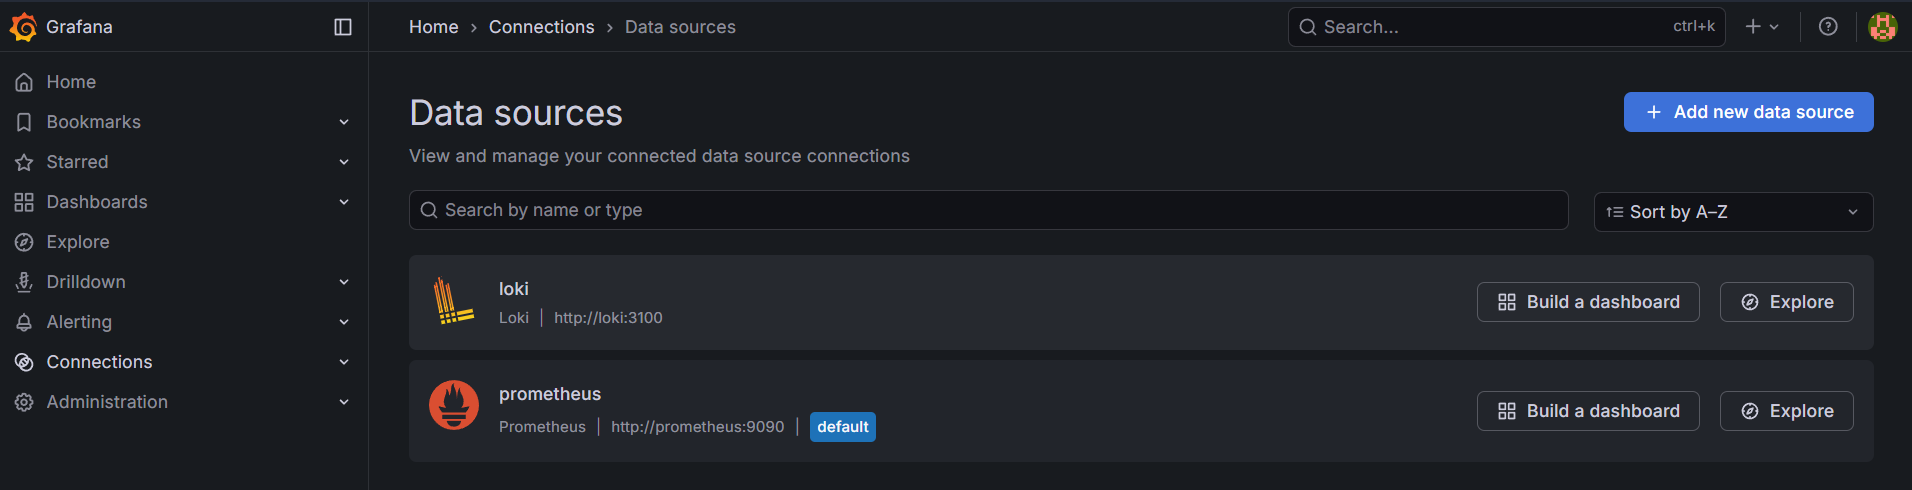
Grafana: unified visualization
Grafana is the visualization layer that unifies everything. It’s the web interface I consult daily and that allows me to:
- Create custom dashboards
- Configure alerts
- Cross-reference metrics and logs
- Share views with others if necessary
Grafana’s major advantage is its ability to simultaneously query Prometheus for metrics and Loki for logs, providing a complete view of the system’s state.
The security dashboard
One of the most critical dashboards I’ve set up is dedicated to security. It allows me to monitor intrusion attempts and the effectiveness of my defenses.
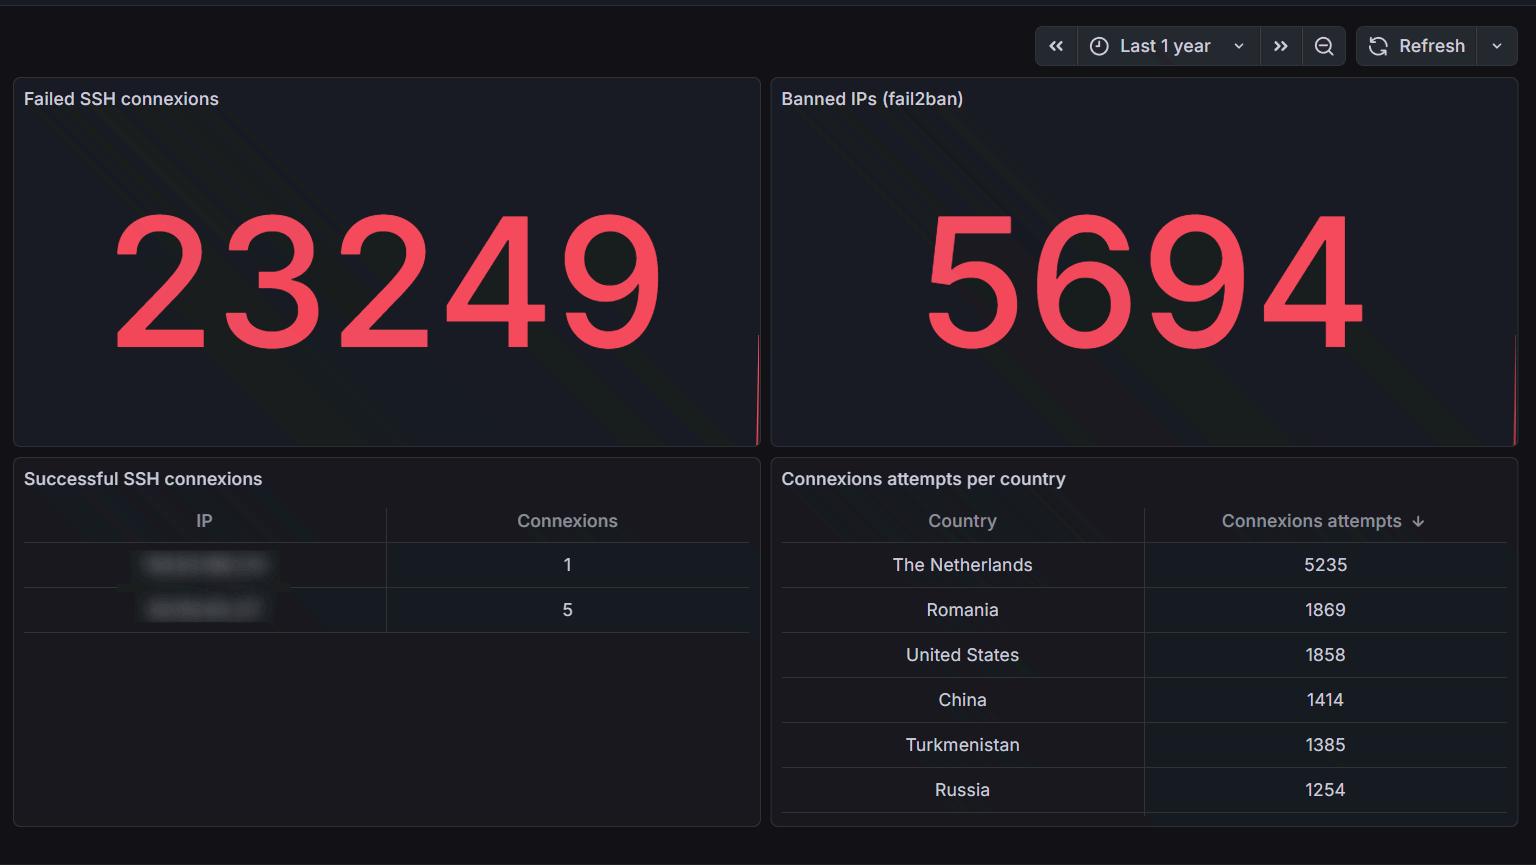
Fail2ban
Fail2ban is an essential tool that analyzes logs and automatically bans suspicious IPs. On my security dashboard, I can see:
- 23,249 failed SSH connection attempts over the past year
- 5,694 IPs banned by fail2ban
- A geographical distribution of attacks
These numbers might seem alarming, but they’re actually perfectly normal for an Internet-exposed server. What matters is that none of these attempts succeeded thanks to the security measures in place.
VPS security basics
Beyond monitoring, here are the minimum measures every administrator should implement on a VPS:
I. SSH key authentication
Never allow password authentication for SSH. This is rule number one. SSH keys offer far superior security:
# On your local machine, generate a key pair
ssh-keygen -t ed25519 -C "your_email@example.com"

# Copy the public key to the server
ssh-copy-id user@your-server

# On the server, disable password authentication
# In /etc/ssh/sshd_config:
# PasswordAuthentication no
# PubkeyAuthentication yes
This single measure eliminates nearly all brute-force intrusion attempts.
II. Fail2ban: automatic banning
Fail2ban monitors logs and automatically bans IPs showing suspicious behavior:
# Installation
apt install fail2ban

# Basic SSH configuration
# /etc/fail2ban/jail.local
[sshd]
enabled = true
port = ssh
filter = sshd
logpath = /var/log/auth.log
maxretry = 3
bantime = 3600
findtime = 600
With these settings, an IP with 3 failed connections in 10 minutes will be banned for 1 hour.
III. Other essential measures
Other basic security practices include:
- Changing the default SSH port (22) to a non-standard port
- Configuring a firewall (ufw or iptables) to allow only necessary ports
- Disabling root login via SSH
- Keeping the system updated with automatic security updates
- Using sudo rather than working as root
- Enabling automatic updates for security patches
Architecture implementation
Here’s how I structured my monitoring infrastructure:
VPS
├── Application services
│   └── Docker containers
├── Prometheus (port 9090)
│   ├── Node Exporter (9100)
│   ├── Prometheus (time-series DB)
│   └── Metrics scraping
├── Loki (port 3100)
│   ├── Promtail (collection agent)
│   └── Log storage
└── Grafana (port 3001)
    ├── Custom dashboards
    ├── Alerting
    └── Datasources (Prometheus + Loki)
All these services run in Docker containers to facilitate deployment and maintenance. Access to Grafana is secured via a Cloudflare tunnel.
Conclusion
Setting up a monitoring dashboard with the PLG stack and basic security measures like fail2ban and SSH key authentication isn’t a luxury, it’s a necessity.
The good news is that these tools are open-source, free, and relatively simple to implement. The initial time investment is largely offset by the peace of mind that comes with an observable and secure infrastructure.
If you manage a VPS and haven’t yet implemented these measures, I strongly encourage you to do so.
Useful resources:
The dashboards presented in this article are publicly accessible on my demo infrastructure. Feel free to reach out if you have questions about the implementation!